Under review
Automatic evaluation of image and video captioning is essential for benchmarking multimodal systems; however, standard evaluation metrics show limited alignment with human judgments. Recent LLM-as-a-Judge approaches have improved alignment with human judgments but still suffer from a mismatch between large-vocabulary language modeling and evaluation over a small label set. To address this, we propose Rigel, an automatic evaluation metric for image and video captioning, based on self-distilled score adaptation. The metric employs an evaluation-specific scoring head distilled from a frozen LLM, which captures judgment signals in a task-aligned space without relying on large-vocabulary token sets. We then refine the LLM backbone with human judgment data. To train Rigel, we construct the Vid-Lepus dataset containing 3,338 video clips, 33,380 reference captions, and 5,637 candidate captions. Experiments on multiple benchmarks show that Rigel outperforms state-of-the-art metrics, achieving over 10-point improvements on ActivityNet-Fact.
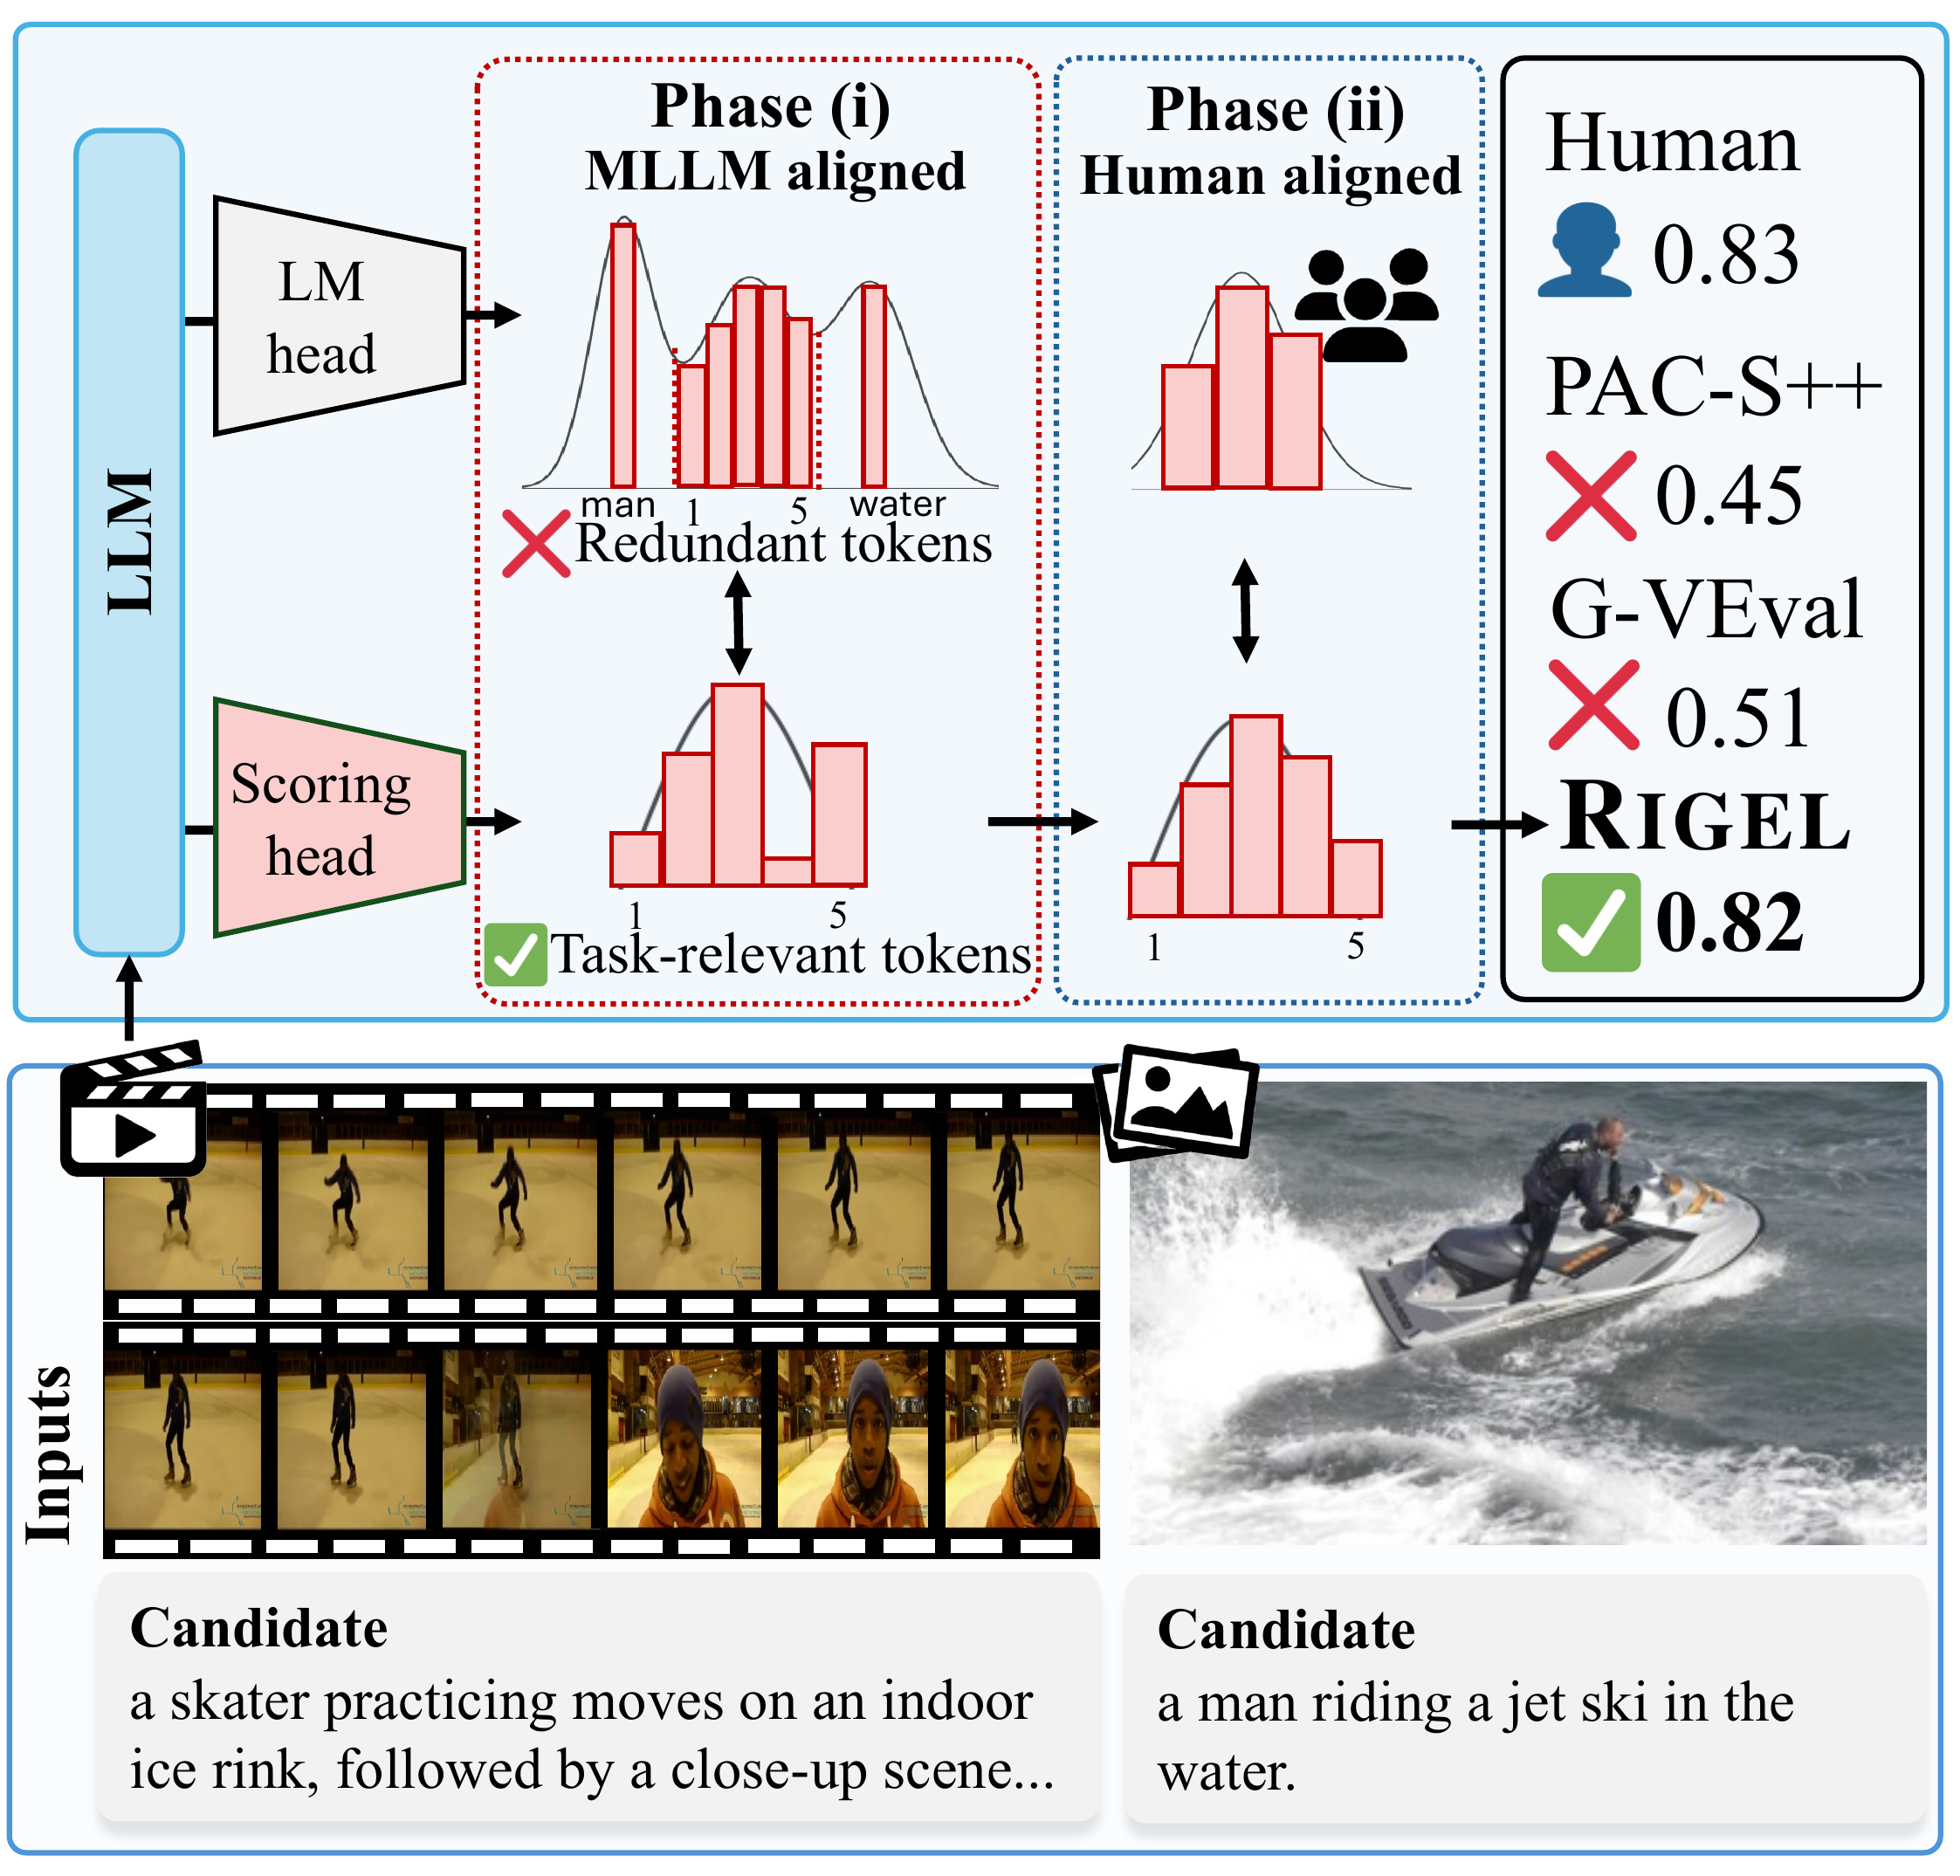
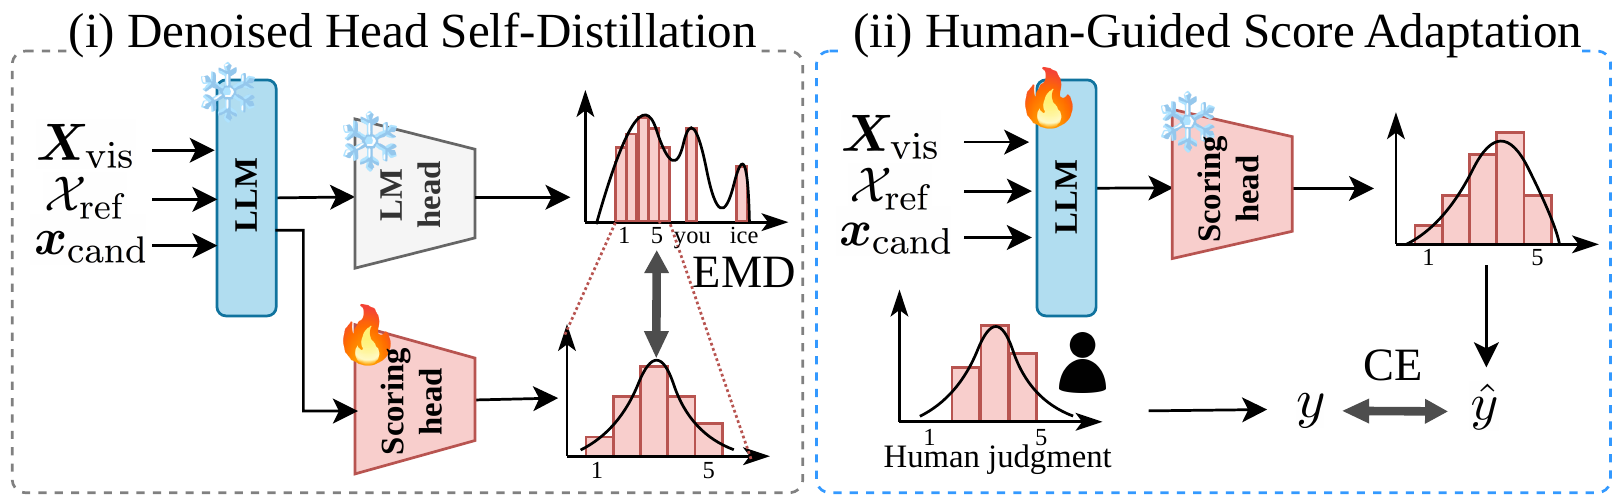
Rigel is an automatic evaluation metric for image and video captions, based on self-distilled score adaptation.
Recent LLM-based approaches such as FLEUR and G-VEval yield more interpretable judgments than traditional metrics. However, these methods are limited by their reliance on predefined token sets for scoring: the LM head operates over a large vocabulary \(\mathcal{V}\) (\(|\mathcal{V}| \sim 10^{5}\)), whereas evaluation only requires prediction over a small ordinal label set \(\mathcal{M}\) (\(|\mathcal{M}| \ll |\mathcal{V}|\)).
The logit distribution over score tokens ("1"–"5") and non-score tokens on the Spica (left) and Composite (right) dataset. Non-score tokens exhibit logit magnitudes comparable to those of score tokens across the four models. This observation provides partial evidence for our claim that non-score tokens function as noise in score prediction.
Overview of our proposed two-phase training framework. (i) Scoring head (red block) is trained with 5 labels using Earth Mover's Distance (EMD) while the LLM and the LM head are frozen. (ii) The LLM backbone is fine-tuned using human judgments while freezing the scoring head's parameters. CE represents cross-entropy.
Rigel achieves superior correlation with human judgments on most benchmarks compared to existing metrics.
| Methods | Flickr8K-Expert | Flickr8K-CF | Nebula | Composite | FOIL | |||||
|---|---|---|---|---|---|---|---|---|---|---|
| τb | τc | τb | τc | τb | τc | τb | τc | 1-ref[%] | 4-ref[%] | |
| Reference-based | ||||||||||
| BLEU | 30.6 | 30.8 | 16.4 | 8.7 | 46.5 | 44.1 | 28.3 | 30.6 | 66.5 | 82.6 |
| ROUGE | 32.1 | 32.3 | 19.9 | 10.3 | 45.8 | 43.4 | 30.0 | 32.4 | 71.7 | 79.3 |
| CIDEr | 43.6 | 43.9 | 24.6 | 12.7 | 51.5 | 48.8 | 34.9 | 37.7 | 82.5 | 90.6 |
| METEOR | 41.5 | 41.8 | 22.2 | 11.5 | 50.2 | 47.6 | 36.0 | 38.9 | 78.8 | 82.6 |
| SPICE | 51.7 | 44.9 | 24.4 | 12.0 | 51.5 | 47.4 | 38.8 | 40.3 | 75.5 | 86.1 |
| BERTScore | 37.8 | 46.7 | 22.8 | 11.5 | 47.5 | 47.1 | 30.2 | 30.1 | 88.6 | 92.1 |
| RefCLIP-S | 52.6 | 53.0 | 36.4 | 18.8 | 53.6 | 50.8 | 51.2 | 55.4 | 91.0 | 92.6 |
| RefPAC-S | 55.5 | 55.9 | 37.6 | 19.5 | 54.7 | 51.9 | 53.0 | 57.3 | 93.7 | 94.9 |
| Polos | 56.1 | 56.4 | 37.8 | 19.5 | 58.0 | 55.0 | 53.7 | 57.6 | 93.3 | 95.4 |
| Ref-HICEScore | 57.2 | 57.7 | 38.2 | 19.8 | – | – | 53.9 | 58.7 | 96.4 | 97.0 |
| DENEB | 55.6 | 56.5 | 38.0 | 19.6 | 58.1 | 55.1 | 54.0 | 57.9 | 95.1 | 96.1 |
| RefPAC-S++ | 55.3 | 55.7 | 37.9 | 19.6 | 53.3 | 50.6 | 54.7 | 59.1 | 93.5 | 94.1 |
| Pearl | 58.2 | 58.6 | 38.6 | 20.0 | 58.4 | 55.4 | 55.8 | 60.4 | 96.5 | 97.2 |
| HiFiScore | – | 58.4 | – | – | – | – | – | 65.8 | – | – |
| CLAIR | 58.3 | 48.8 | 38.2 | 17.0 | – | – | – | 61.0 | – | 93.6 |
| Ref-FLEUR | – | 51.9 | 38.8 | – | – | – | – | 64.2 | 97.3 | 98.4 |
| G-VEval | 60.5 | 58.7 | 38.2 | 19.9 | – | – | – | – | 97.8 | 98.4 |
| Rigel | 58.6 | 59.0 | 40.4 | 20.9 | 60.6 | 57.5 | 61.2 | 66.1 | 99.1 | 99.2 |
| Reference-free | ||||||||||
| CLIP-S | 51.1 | 51.2 | 34.4 | 17.7 | 50.5 | 47.9 | 49.8 | 53.8 | 87.2 | 87.2 |
| PAC-S | 53.9 | 54.3 | 36.0 | 18.6 | 51.0 | 48.3 | 51.5 | 55.7 | 89.9 | 89.9 |
| BRIDGE | 55.4 | 55.8 | 36.3 | 19.0 | – | – | 52.9 | 57.2 | 93.0 | 93.0 |
| HICEScore | 55.9 | 56.4 | 37.2 | 19.2 | – | – | 53.1 | 57.9 | 93.1 | 93.1 |
| PAC-S++ | 54.1 | 54.5 | 37.0 | 19.1 | 50.5 | 47.9 | 53.9 | 58.3 | 90.2 | 90.2 |
| BLIP2-Score | 52.2 | 52.5 | 36.7 | 19.0 | 53.0 | 50.7 | 56.9 | 61.5 | 94.3 | 94.3 |
| Pearl | 56.2 | 56.6 | 37.8 | 19.5 | 55.9 | 53.0 | 54.0 | 58.4 | 96.7 | 96.7 |
| HiFiScore | – | 58.4 | – | – | – | – | – | 65.7 | – | – |
| FLEUR | – | 53.0 | 38.6 | – | – | – | – | 63.5 | 96.8 | 96.8 |
| G-VEval | 61.5 | 59.7 | 38.7 | 20.2 | – | – | – | – | – | – |
| EXPERT | – | 56.7 | 39.3 | – | – | 54.9 | – | 65.0 | – | – |
| DISCODE (LLaVA) | 55.7 | 56.1 | 40.2 | 20.8 | – | – | 61.1 | 66.0 | – | – |
| DISCODE (InternVL) | 57.7 | 58.1 | 40.1 | 20.8 | – | – | 60.5 | 64.9 | 98.2 | 98.2 |
| Rigel | 59.5 | 59.9 | 40.4 | 20.9 | 58.1 | 55.1 | 59.5 | 64.3 | 98.7 | 98.7 |
Quantitative comparison on image captioning evaluation benchmarks. “τb” and “τc” represent Kendall's τb and τc correlation coefficients, respectively. Bold indicates the best result and underlining indicates the second best result in each column.
| Metrics | VATEX-EVAL | ActivityNet-Fact | YouCook2-Fact | ActivityNet-FOIL | |||||||
|---|---|---|---|---|---|---|---|---|---|---|---|
| 1-ref | 9-ref | Para | Sent | Word | Para | Sent | Word | Accuracy [%] | |||
| τb | ρ | τb | ρ | r | r | r | r | r | r | ||
| Reference-based | |||||||||||
| EMScore | 28.6 | 37.1 | 36.8 | 47.2 | 42.7 | 35.2 | 44.6 | 54.3 | 51.4 | 55.3 | 92.4 |
| RefPAC-S | 31.4 | 40.5 | 38.1 | 48.8 | 47.0 | 37.8 | 49.5 | 56.2 | 54.4 | 57.0 | 93.5 |
| RefPAC-S++ | 32.2 | 41.5 | 39.8 | 50.8 | – | – | – | – | – | – | 93.4 |
| FactVC | – | – | – | – | 55.1 | 46.5 | 54.5 | 60.6 | 58.3 | 61.5 | – |
| G-VEval | 44.9 | – | 48.1 | – | 56.6 | 48.1 | 48.8 | 72.4 | 66.7 | 62.4 | – |
| Rigel | 45.6 | 57.8 | 50.8 | 64.0 | 67.8 | 54.0 | 65.7 | 65.4 | 60.8 | 61.7 | 97.1 |
| Reference-free | |||||||||||
| EMScore | 23.2 | 30.3 | 23.2 | 30.3 | 25.3 | 19.0 | 30.0 | 33.7 | 35.3 | 36.1 | 89.5 |
| PAC-S | 25.1 | 32.6 | 25.1 | 32.6 | 33.2 | 27.1 | 38.4 | 31.2 | 33.5 | 33.1 | 90.1 |
| PAC-S++ | 28.1 | 36.4 | 28.1 | 36.4 | – | – | – | – | – | – | 91.0 |
| FactVC | – | – | – | – | 46.2 | 37.1 | 48.0 | 40.8 | 41.0 | 42.0 | – |
| G-VEval | 39.4 | – | 39.4 | – | 48.8 | 38.6 | 43.6 | 55.8 | 50.1 | 44.4 | – |
| Rigel | 42.1 | 53.7 | 42.1 | 53.7 | 63.6 | 51.9 | 60.5 | 55.0 | 50.3 | 50.0 | 96.2 |
Quantitative comparison on video captioning evaluation benchmarks. “ρ” and “r” represent Spearman's and Pearson's correlation coefficients, respectively. Bold indicates the best result and underlining indicates the second best result in each column.
Qualitative examples on image captioning. Rigel (highlighted) is compared against human judgments and baseline metrics.
Qualitative examples on video captioning. Rigel (highlighted) is compared against human judgments and baseline metrics.
Coming soon.